Bitcoin Price Holds $29k Support: Is BTC Sweeping $25k Lows After FOMC?
How To Prepare Amid A Glaring Bitcoin Price Sell-Off
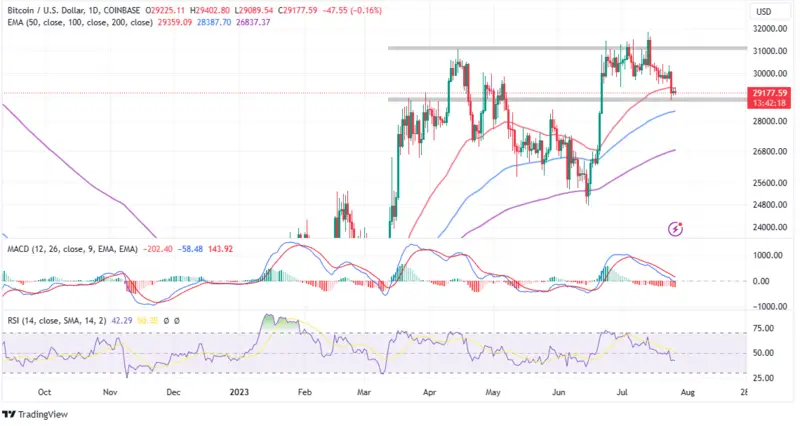
Bitcoin price holds slightly above $29,200 with the 50-day Exponential Moving Average (EMA) (red) acting as resistance at $29,360. Although support at $29,000 is holding steadily, the technical picture is leaning heavily toward the bearish side.
A sell signal from the Moving Average Convergence Divergence (MACD) implies that sellers have the upper hand and that the path with the least resistance is southbound. If losses are sustained below the immediate support, short positions in BTC may turn profitable toward $28,000 with a further drop to $25,000 becoming apparent.
Most analysts anticipated declines to dominate the Bitcoin market toward the end of the week, especially with the United States Federal Open Market Committee (FOMC) deliberating on a possible interest rate hike on Wednesday.
“With all the upcoming events, I wouldn’t be surprised we’ll sweep the lows on #Bitcoin first before we’ll reverse back up,” Michaël van de Poppe told his over 661k followers on Twitter.
Recommended Articles

Crypto Presale Projects For 2023 To Invest; Updated List
Must Read
Best Crypto Exchange Affiliate Programs In 2023
Must Read
Top Crypto Marketing Firms / Agencies 2023; Here’s Best Picks [Updated]
Must Read
Crypto Telegram Channels List 2023 [Updated]
Must Read
Top 10 Web3 Games To Explore In 2023; Here List
Must ReadIn addition to the FOMC deliberation of a possible 25 basis point hike, reports on the real GDP and Personal Consumption Expenditure (PCE) are just as important events to look forward to on Friday.
With all the upcoming events, I wouldn't be surprised we'll sweep the lows on #Bitcoin first before we'll reverse back up.
Tonight might not be the most important thing, GDP and PCE are just as important. pic.twitter.com/1zYSdhXhy5
— Michaël van de Poppe (@CryptoMichNL) July 26, 2023
Captain Faibik, another analyst believes Bitcoin price may continue to move above a long-term trendline on the daily chart. Meanwhile, the Bollinger Bands on the weekly timeframe “shows all-time low-price volatility.”
Investors should be cautious as major breakouts tend to occur following “deep silence” in the crypto market.
$BTC Still Moving above the Major Trendline on the 1D TF Chart.
Bollinger Bands (Weekly) Shows All time low Price Volatility.
Deep Silence 💤😶#Crypto #Bitcoin #BTC pic.twitter.com/tbBFsnbLuP
— Captain Faibik (@CryptoFaibik) July 26, 2023
A break below the trendline as presented by Faibik implies the possibility of a massive sell-off to $28,000 and $25,000, respectively.
Is An Uptrend in Bitcoin Price Viable?
For now, the path with the least resistance is to the downside. Moreover, this situation appears to be worsening with everyday BTC holds below $30,000. The Relative Strength Index (RSI) on the daily chart reinforces the bearish grip as it slides below down in the neutral zone, and closes in on the oversold region.
Watching the behavior of Bitcoin whales is another strategy both experienced and novice traders can apply to stay profitable in a tradable condition such as the ranging channel between $28,000 and $32,000.
According to Glassnode, an on-chain analytics platform addresses with between 1,000 and 10,000 BTC have been capitalizing on the gradual retracement in Bitcoin price to up their balance by approximately 33,800 BTC.
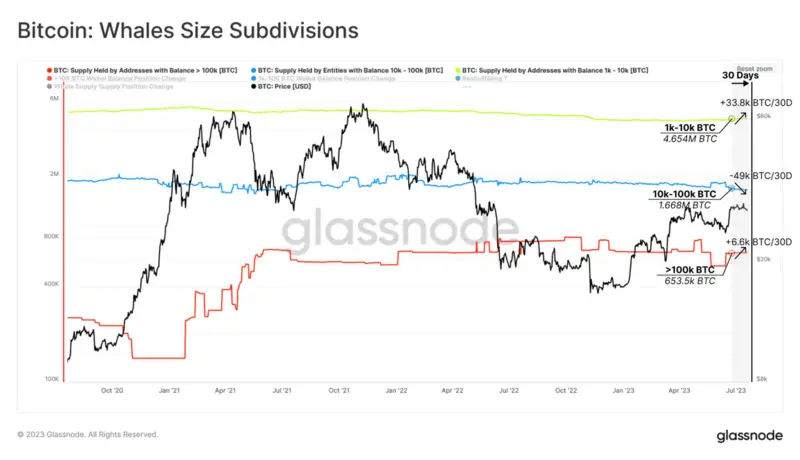
A similar trend was noticeable with whales with more than 100,000 BTC, whose holdings ticked by 6,600 BTC. Despite these efforts, Glassnode mentioned a “net reduction of -8.7k BTC,” caused by holders of between 10k and 100k BTC reducing their balance by 49,000 BTC.
Overall, the net selling pressure is marginal with Bitcoin price likely to keep trading in the range, unless the FOMC or other economic events mentioned earlier trigger a selloff.
Related Articles
- Binance Goes Zero Trading Fee On First Digital USD (FDUSD) Listing
- Avalanche Foundation Unveils $50 Million Initiative To Boost Tokenized Assets
- Dogecoin Price Up 10%; Will X (Twitter) Hype Move Price Past $0.09?